Our Dashboard is the very first thing users will see upon logging into the Business Engine tool, users will be able to quickly find important information such as new Customer Orders and any Outages or Disruptions to your network.
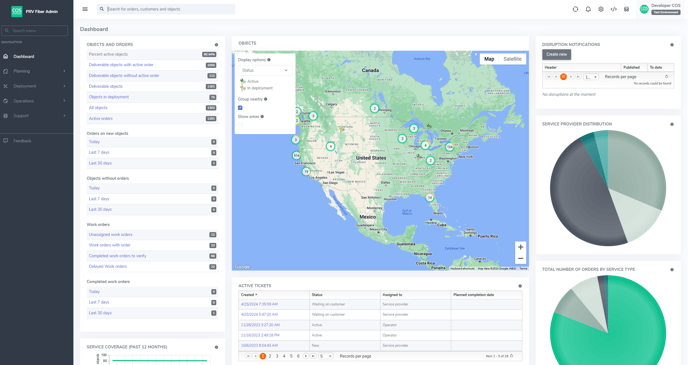
As seen above you will also be able to see any active Tickets that have been reported by customers and have access to a variety of filters to analyze information on Customer Addresses (Objects) and new Orders during specific windows of time such as over the past 7 days or even 30 days.
Users will also be able to quickly access more detailed information by using the dropdown menu found to the left of the Dashboard.
Here users will be able to use our Planning menu to gain further insight into their available Service Areas and detailed information on active Customers and potential Prospects.

The Deployment menu will allow Users to check on and make updates to Work Orders and the Work Order Taks associated with them such as Drop or ONT installations.

The Operations menu will have a list of Customer centric information such as Invoices and past or currently active Orders.
Lastly, the Support menu will provide information pertaining to the status of your Network. Here you will be able to monitor and create new Disruption Notifications as well as monitor any active or past Tickets relating to Customers losing Service.
Step By Step Instructions
Business Engine Dashboard